Name: Trey Riley
Lab Experiment
#8: Spectroscopy
Date: March 30, 2016
Abstract
The purpose of this lab and this report is to become
familiarized with the chemical compositions of elements, and the practices and
methods of determining elemental composition. A spectrometer was used, as well
as a diffraction grating, to see the visible spectra produced by different
elemental gases, as well as continuous spectra from certain light sources.
Seven sources of light were observed with a spectrometer. Our goal was to
determine which element made up the gas by using data recorded from
observations with the spectrometer. Once the data was recorded, our data was
either confirmed or denied by online sources. These sources eventually lead us
to the conclusion of the six different elements present in each light source.
Introduction
This report has three distinctive experiments. The purpose in
doing the first experiment is to become familiar with a diffraction grating and
a spectrometer. A ceiling light was viewed with the diffraction grating, and
the spectrum observed was to be recorded. The spectrometer was then calibrated
on a light source to use for the rest of the experiment. Important features of
the spectrometer were to be noted, such as the wavelength scale labeled from
700 to 400 nanometers from left to right. Proper usage was demonstrated and
repeated by students, and thus the rest of the experiment began.
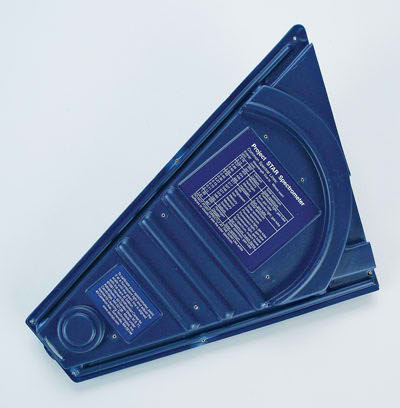 |
| Spectrometer used during experiment |
The second experiment conducted
consisted of viewing an incandescent bulb with the spectrometer. A continuous
spectrum was to be observed if the spectrometer was calibrated correctly. The
patterns of color were to be noted on the wavelength scale. The end of the
spectrum was also to be noted on the far left and far right to indicate the
wavelength limits of the sensitivity of the human eye.
In the third experiment, several spectra
of elements were observed at different stations. The spectrometer was to be
used, and specific wavelengths were to be recorded. The color of the gas, as
well, was to be noted to help indicate which element is within the unlabeled
gas tubes. Specific elements emit only one color of light to the human eye.
This color that we see is actually all of the different colors in the elements
spectrum blended together. Pictures were to be taken of our spectra that we
observed, but taking the picture was much harder than expected, viewing the
spectrum through the narrow slit of the spectrometer.
Procedures
Throughout each individual experiment, a
spectrometer or diffraction grating was used. When determining composition of
gases, online sources were consulted to confirm or deny or results. If an
ambiguous answer was given by an online source, another was consulted until a
confirmation was given that multiple students could agree upon. Pictures were
not taken of the spectrum I observed due to the difficulty of the operation.
Spectra of elements were found online through a spectrometer that closely
resembled what I viewed.
Results
and Discussion
Experiment One
The
continuous spectrum was observed from the ceiling light using the diffraction
grating. The spectrometer was calibrated, and all important features were known. In the picture, the closest to the light source is violet, while the furthest is red.
 |
| Diffraction grating of ceiling light |
Experiment Two
The
continuous spectrum was observed using the spectrometer. The wavelength limits
of the sensitivity of the human eye were though to be 700 to 400 nanometers, but the exact quantities seemed to be 660 and 420.
 |
| Continuous spectrum observed from desk lamp |
Experiment Three
Seven stations
were observed with a spectrometer. All measurements are in nanometers, (10^(-9))m.
·
Station
1: Continuous spectrum observed from incandescent light bulb
·
Station
2: Emission lines observed at 655, 590, 490
 |
| Hydrogen emission spectrum |
Observed Gas: Faint Purple
 |
| Hydrogen gas |
Conclusion:
Hydrogen
·
Station
3: Multiple emission lines observed from 700-580, 540, 535, 505
 |
| Neon emission spectrum |
Observed Gas: Bright Red Orange
 |
| Neon gas |
Conclusion: Neon
·
Station
4: Emission lines observed at 590, 560, 510 and 430
 |
| Krypton emission spectrum |
Observed Gas: Bright Faint Blue
 |
| Krypton gas |
Conclusion:
Krypton
·
Station
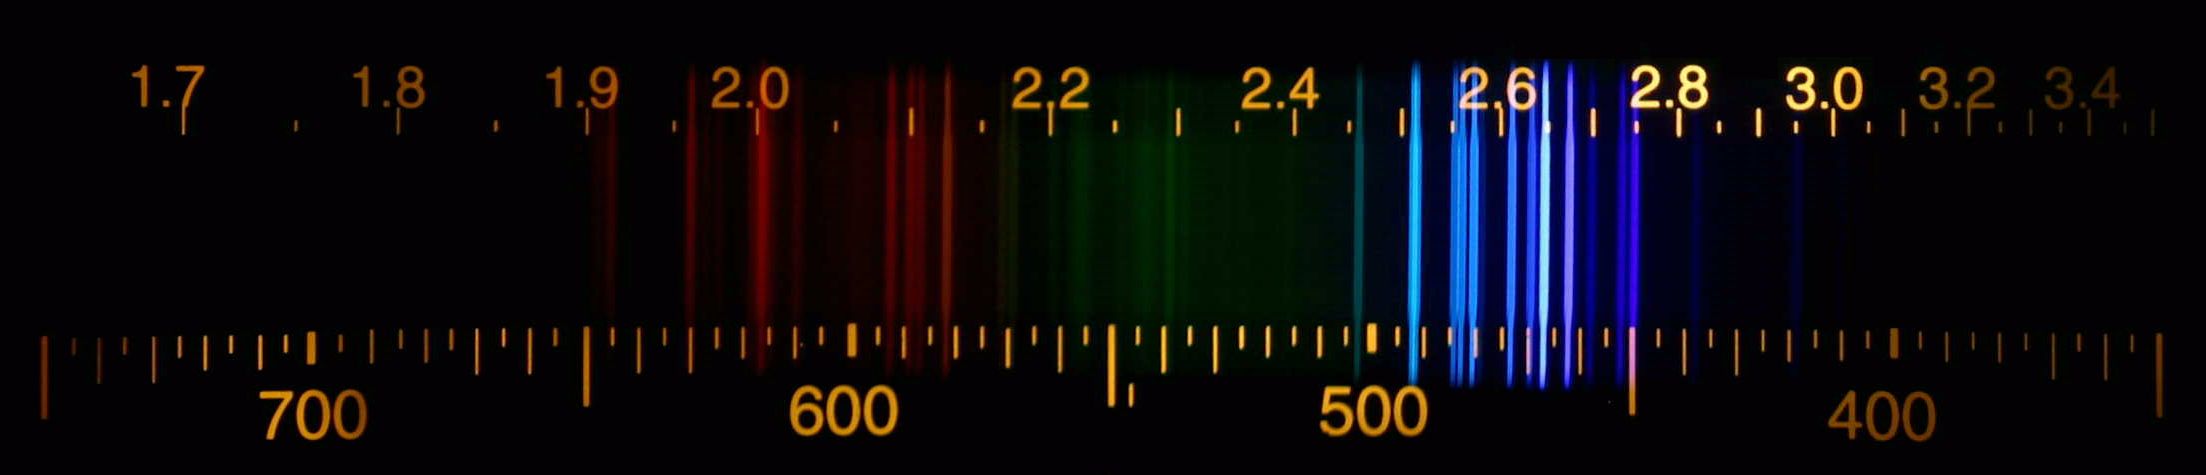
5: Emission lines observed at 700, 660, 580, 495, 485, 463, 420, 400
 |
| Helium emission spectrum |
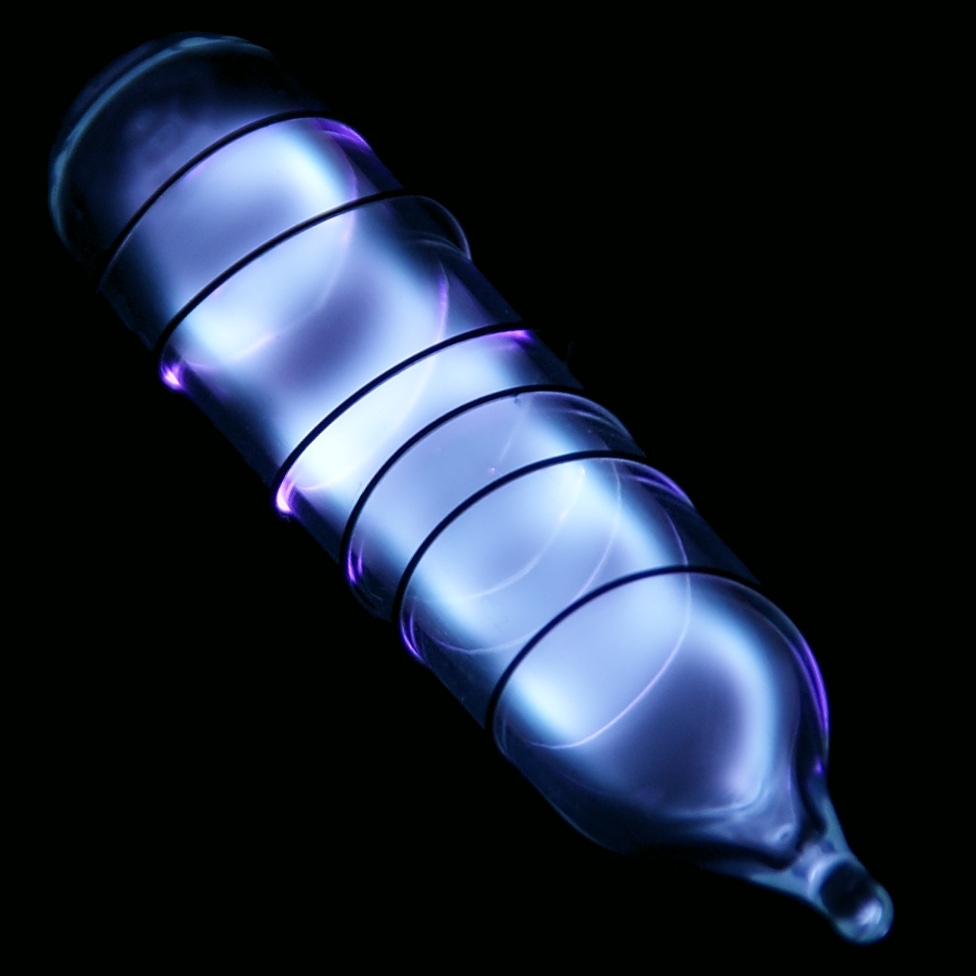
Observed Gas: Faint
Orange
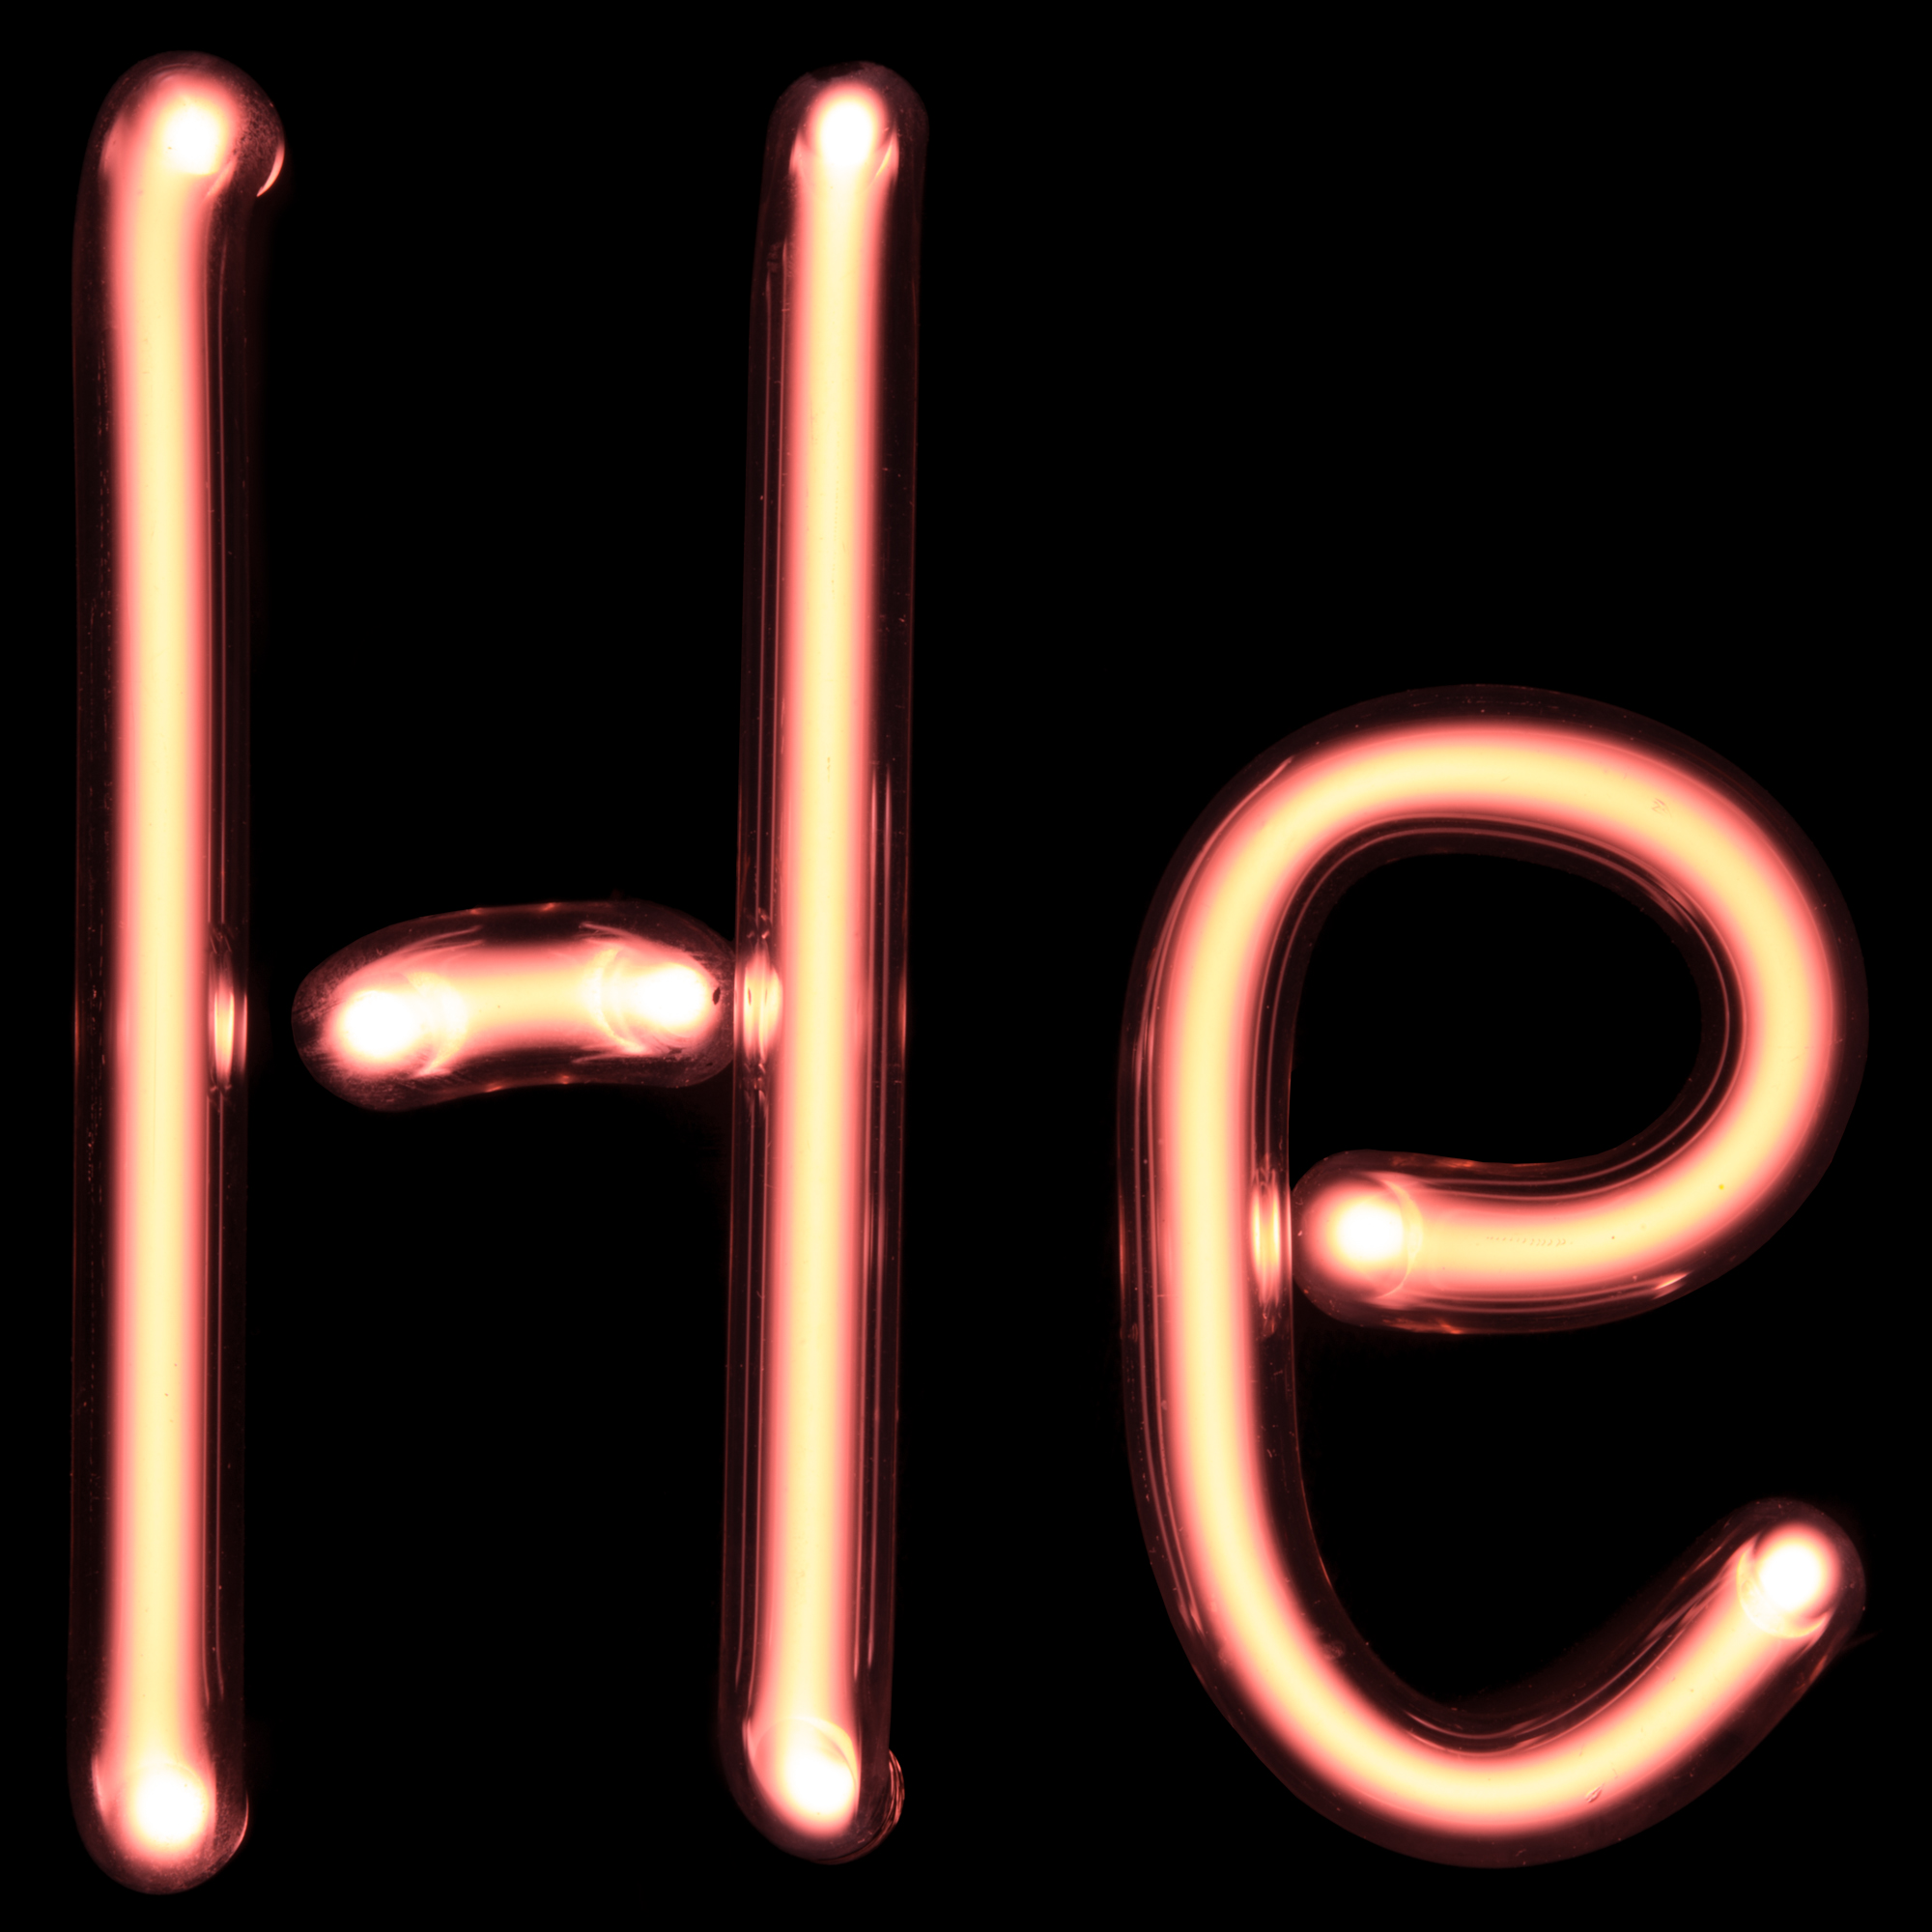 |
| Helium gas |
Conclusion: Helium
·
Station
6: Emission lines observed at 615, 590, 575, 545, 495, 485
 |
| Sodium emission spectrum |
Observed Gas: Bright
Orange/Yellow
 |
| Sodium gas |
Conclusion: Sodium
·
Station
7: Emission lines observed at 575, 545, 490, 430, 400
 |
| Xenon emission spectrum |
Observed Gas: Bright White
 |
| Xenon gas |
Conclusion:
Xenon
Conclusion
The objective of this lab and report was
to gain a better understanding of spectrometry. This was achieved through use
of a diffraction grating and spectrometer. Different spectra were observed
through different methods. Incandescent bulbs produce a continuous spectrum
through a diffraction grating and a spectrometer. Each separate gas tube held a
different gas with different and unique spectra. Data did not directly prove one gas, but definitely implied one gas. Some source for error may have been light from other station being observed in the spectrometer causing false readings, or possibly reading some spectra of the oxygen and nitrogen gas in air. Dealing with each type of
spectra helped students gain a better and more practical application of how
spectrometry is used in astronomy.
About "The wavelength limits of the sensitivity of the human eye were though to be 700 to 400 nanometers, but the exact quantities seemed to be 660 and 420":
ReplyDeleteYou should have tried using say 10 lamps at the same time and cover the center of the spectrogram.